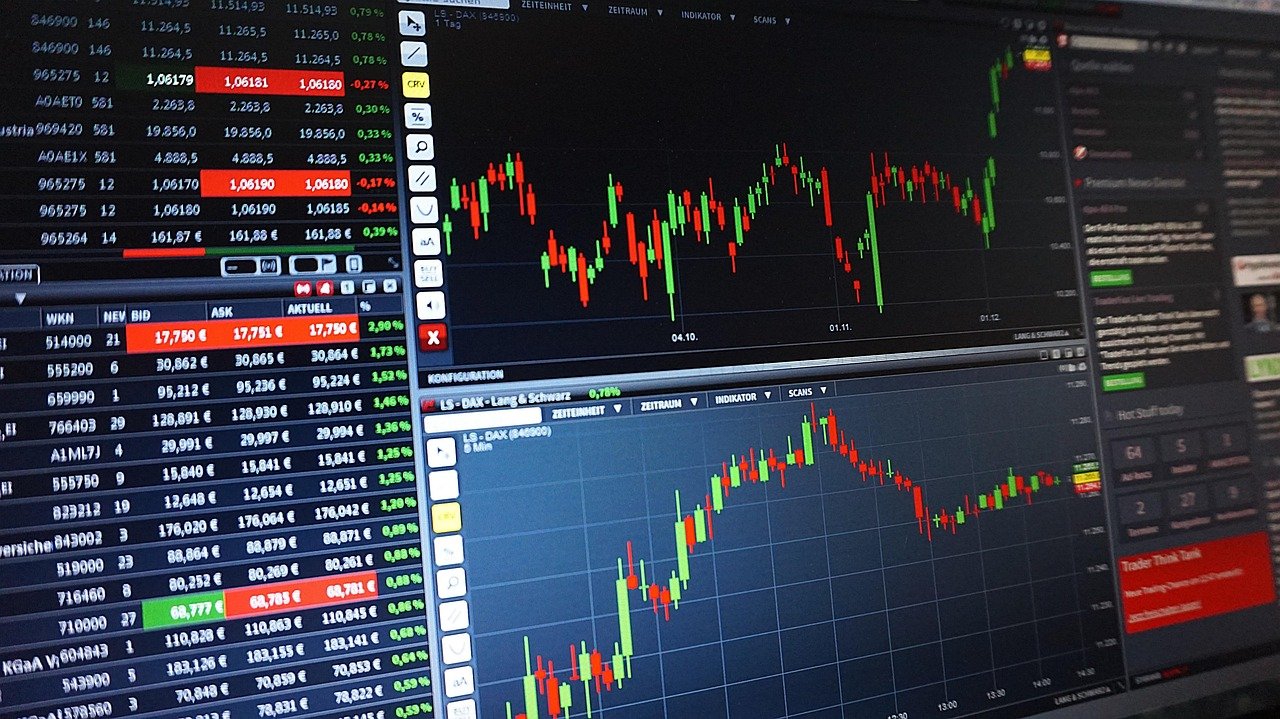
Quick answer: Learning how to read crypto charts starts with the axes: price on the vertical axis, time on the horizontal. Then read each candle, check the volume bars beneath it, and settle on one timeframe.
If you have not yet opened an account, the Crypto Trading Basics hub explains how to buy cryptocurrency before you start studying price history. This walkthrough assumes a chart is already open in front of you and reads it from left to right.
Axes and chart types: what a crypto chart shows
A crypto chart plots a coin’s price against time. The vertical axis, or price axis, runs up and down and represents the price of the cryptocurrency, while the horizontal axis represents the time period. An OHLC chart follows the same layout, with price on the y-axis and time on the x-axis. Because time sits on the horizontal axis, you read the chart from left to right, with older price action on the left and the latest on the right.
The price axis tells you where the market has traded. The time axis tells you how long it took to get there. Check both before you read any shape on the chart.
Line, bar and candlestick views
Most platforms let you switch the same data between several views. They differ in how much of each period they show.
| Chart type | What each mark shows | Planning use |
|---|---|---|
| Line chart | Usually one data point per period: the closing price | Useful for a clean view of direction. It does not show the highs and lows within each period. |
| OHLC bar chart | Price on the y-axis, time on the x-axis. Symbols are coloured green when the close is higher than the open, red when it is lower | Suits readers who want open, high, low and close in a compact form. |
| Candlestick chart | A body for the open-to-close difference, with wicks for the highest and lowest prices in the interval | The most detailed of these views. This guide uses it from here on. |
The descriptions follow CoinSpot’s beginner guide to technical analysis.
Reading a single candlestick
A candlestick summarises one time interval using its open, high, low and close prices. Every candle on the chart repeats the same structure, so once you can read one, you can read the whole row.
The body: open to close
The body represents the difference between the opening and closing prices of a cryptocurrency within a specific time interval. A tall body means the price moved a long way between open and close. A short body means it finished close to where it started.
The wicks: high and low
The thin lines above and below the body are the wicks. The top wick indicates the highest price reached during the interval, while the bottom wick shows the lowest price. A long wick tells you the price travelled to that level and was pushed back before the interval ended.
The colour: bullish or bearish
Candles are either bullish (green) or bearish (red). A green candle closed above its open. A red candle closed below its open. Colour tells you only which direction the interval ended in, so combine it with body size and wick length rather than relying on it alone.
Volume bars under the chart
Volume bars show how much of a coin changed hands in each interval. Volume refers to the number of units of a cryptocurrency traded within a specific time period. The bars usually line up beneath the candles, so each candle has a matching bar. For a deeper look at why this matters for buying and selling, see what is trading volume in crypto.
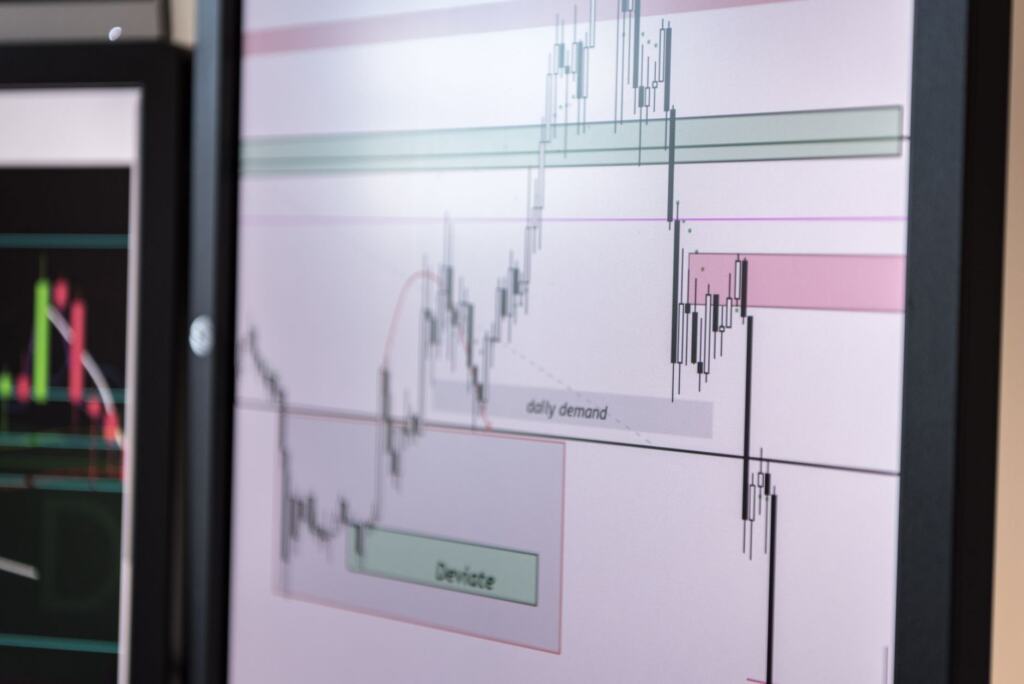
Volume helps you judge how much weight to give a price move:
- Rising price, high volume. According to Obiex’s chart guide, high volume during a price increase usually confirms a strong uptrend.
- Falling price, high volume. The same guide says high volume during a price drop signals strong selling pressure.
- Volume in a bull run. CoinSpot notes that in a bull run, market volume should increase accordingly, so a rally on shrinking volume deserves a second look.
Read the bar and the candle together, one pair at a time. A large candle with a tall volume bar is a stronger statement than the same candle with a small one.
Choosing a timeframe
The timeframe sets how much time each candle covers. Choosing the right time frame is essential because it influences your perspective on market behaviour, and it should match how you plan to trade.
| Timeframe group | Range offered | Planning use |
|---|---|---|
| Short-term | From one-minute charts up to daily charts | Built for short-term traders. Leave these until you can read a candle and its volume bar comfortably. |
| Longer-term | Daily, weekly and monthly charts | Suits longer-term traders and anyone studying the bigger picture. |
| Full span on crypto charts | One minute to one month or more | Shows how far you can zoom in or out on the same coin. |
The ranges come from CoinSpot’s technical analysis guide and Obiex’s chart-reading guide.
Where a beginner should start
Start with the daily chart. Daily is the one setting that appears in both the short-term and the longer-term ranges, so it is a sensible middle ground while you learn. Practise there until you can describe a candle’s body, wicks and volume bar without hesitating. Move to shorter intervals only if your own trading plan calls for them, and move to weekly or monthly when you want a wider view.
Choosing a charting platform
Pick a platform for the features this guide uses, not for its list of extras. Before you commit, check that it can do these things:
- Candlestick view. You need to switch from a line to candles to see open, high, low and close.
- Volume bars. They should sit under the price chart so you can read them against each candle.
- A timeframe selector. Look for a range that covers the daily setting you will begin with and the shorter and longer intervals you may want later.
Indicator and drawing-tool menus are worth exploring once the basics are comfortable. If you are still deciding where to trade, the centralized vs decentralized exchange comparison covers that choice before chart tools come into it.
Troubleshooting common misreads
- The colours look wrong. Body colour can vary between platforms, although usually a red body marks a lower close and a green body a higher one. Check the platform’s settings or legend before you trust a colour.
- The same coin looks calmer or wilder after a change. Each candle covers one interval, so a new timeframe changes what every candle represents. Compare like with like before drawing a conclusion.
- The price is rising but the volume bars are tiny. Low trading volume can indicate weak market interest, which may result in unpredictable price swings. Treat the move with caution.
Frequently asked questions
Where do candlestick charts come from?
According to Bit of Trade, candlesticks were introduced to the Western world in 1991 when Steve Nison published his book on the subject.
Does a green candle mean I should buy?
No. Green only records that the close was above the open for that interval. Following a pattern isn’t a guaranteed prediction, because the market can be volatile.
Do I need indicators to read a chart?
Not for the basics. The axes, candles, volume bars and timeframe give you a complete first reading, and indicators can be added later.